Every opponent, scouted before first pitch.
The Riseball Report is an opponent scouting report built for the series you are about to play: game-by-game win odds, a game plan written in coaching language, the projected lineup and weekend rotation, and the situational tendencies that would take a week of film to find.
Free for coaching staffs · No login · Ready by Thursday
Every prediction was made using only games played before it. See how it was tested.
One opponent. One series. Everything your staff needs by Thursday.
A Riseball Report covers a single opponent for a single series. It is built from every D1 box score and play-by-play log up to the day before the series opens, so it reflects the team you will see this weekend.
The first page answers the questions a staff asks on Wednesday night: who starts game 1, how likely you are to win each game, and where this team can be beaten. Everything after that is the evidence, laid out so an assistant can find a number in the dugout in ten seconds.
Reports come as a web page and a printable PDF. Each one prints its methods at the bottom, so nothing in it is a black box.
- 1Series outlookWin odds for each game and the series, with both likely starters.
- 2Game planTheir biggest departures from D1 average, written as things to do.
- 3Approach and situationsCount tendencies, bunting, running and clutch hitting, as D1 percentiles.
- 4Scoring by inningWhen their runs come and when they give them up.
- 5Starters by trip through the orderHow their starters hold up the first, second and third time through.
- 6Pitch-by-pitch staffFirst-pitch strikes, swing and miss and put-away rate for each pitcher.
- 7Projected lineupThe most likely batting order, with OPS+ in every slot.
- 8Weekend rotation and usageWho starts games 1, 2 and 3, rest patterns, and who finishes.
- 9Hitters, staff and game logEvery player and every result, adjusted for the competition.
Built for staffs without an analytics department
Power-conference programs have analysts. Most D1 staffs have a head coach, two assistants and a stack of box scores. The Riseball Report does the digging so your staff can spend the week coaching.
The scouting is done before you open it
Pulling a season of box scores, rebuilding lineups and tracking a rotation by hand takes most of a week. The report does it for every opponent, every series.
A .350 hitter is not always a .350 hitter
Every rating, OPS+ and ERA− is adjusted for the strength of the opponents behind it, so a gaudy nonconference line gets weighed against the schedule that produced it.
Answers you can use in the dugout
"They take the first pitch." "Their starters are most hittable the first time through." Each finding comes with the number, the D1 average, and what to do about it.
Probabilities you can take at face value
The win odds were tested on 71,278 games. When the model says 80%, favorites have won about 80% of the time. Misses are published too.
Pages from a real report
These come from sample reports built on past seasons. Pick a section.
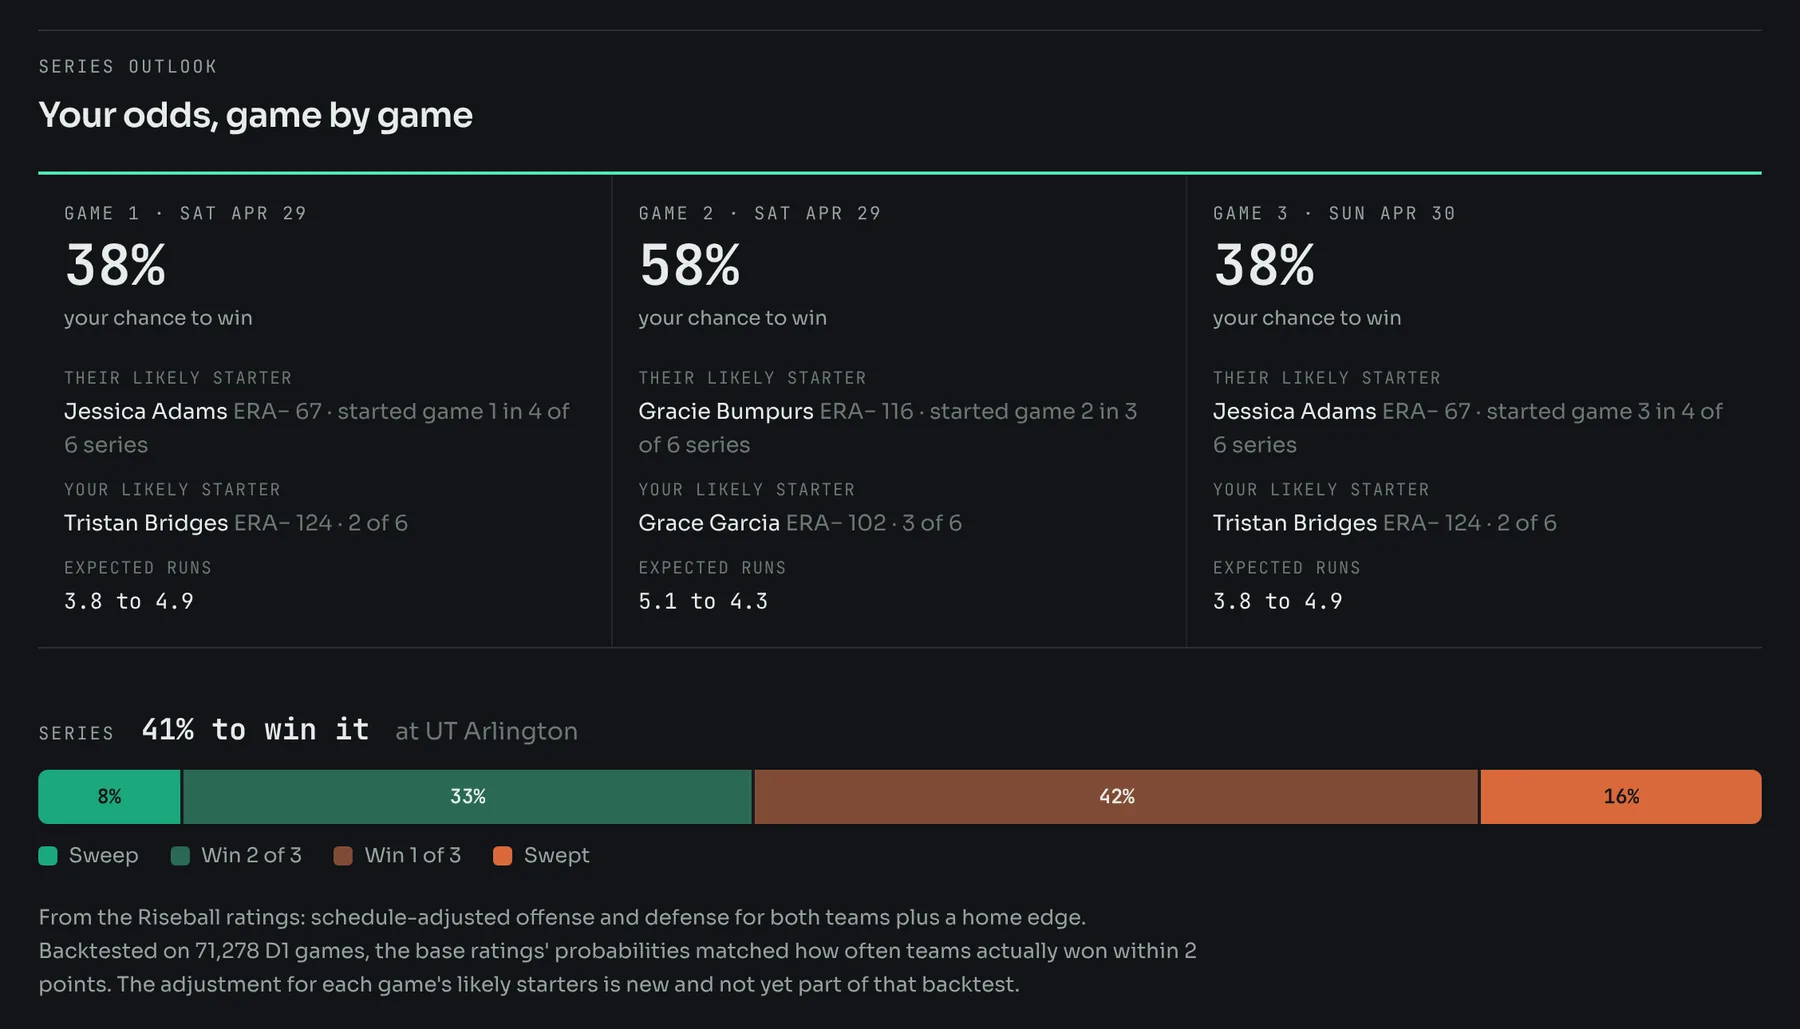
Your odds, game by game
Both teams' schedule-adjusted ratings, a home edge, and an adjustment for each game's likely starters.
- Win chance for every game
- Series odds from sweep to swept
- Expected runs for each side
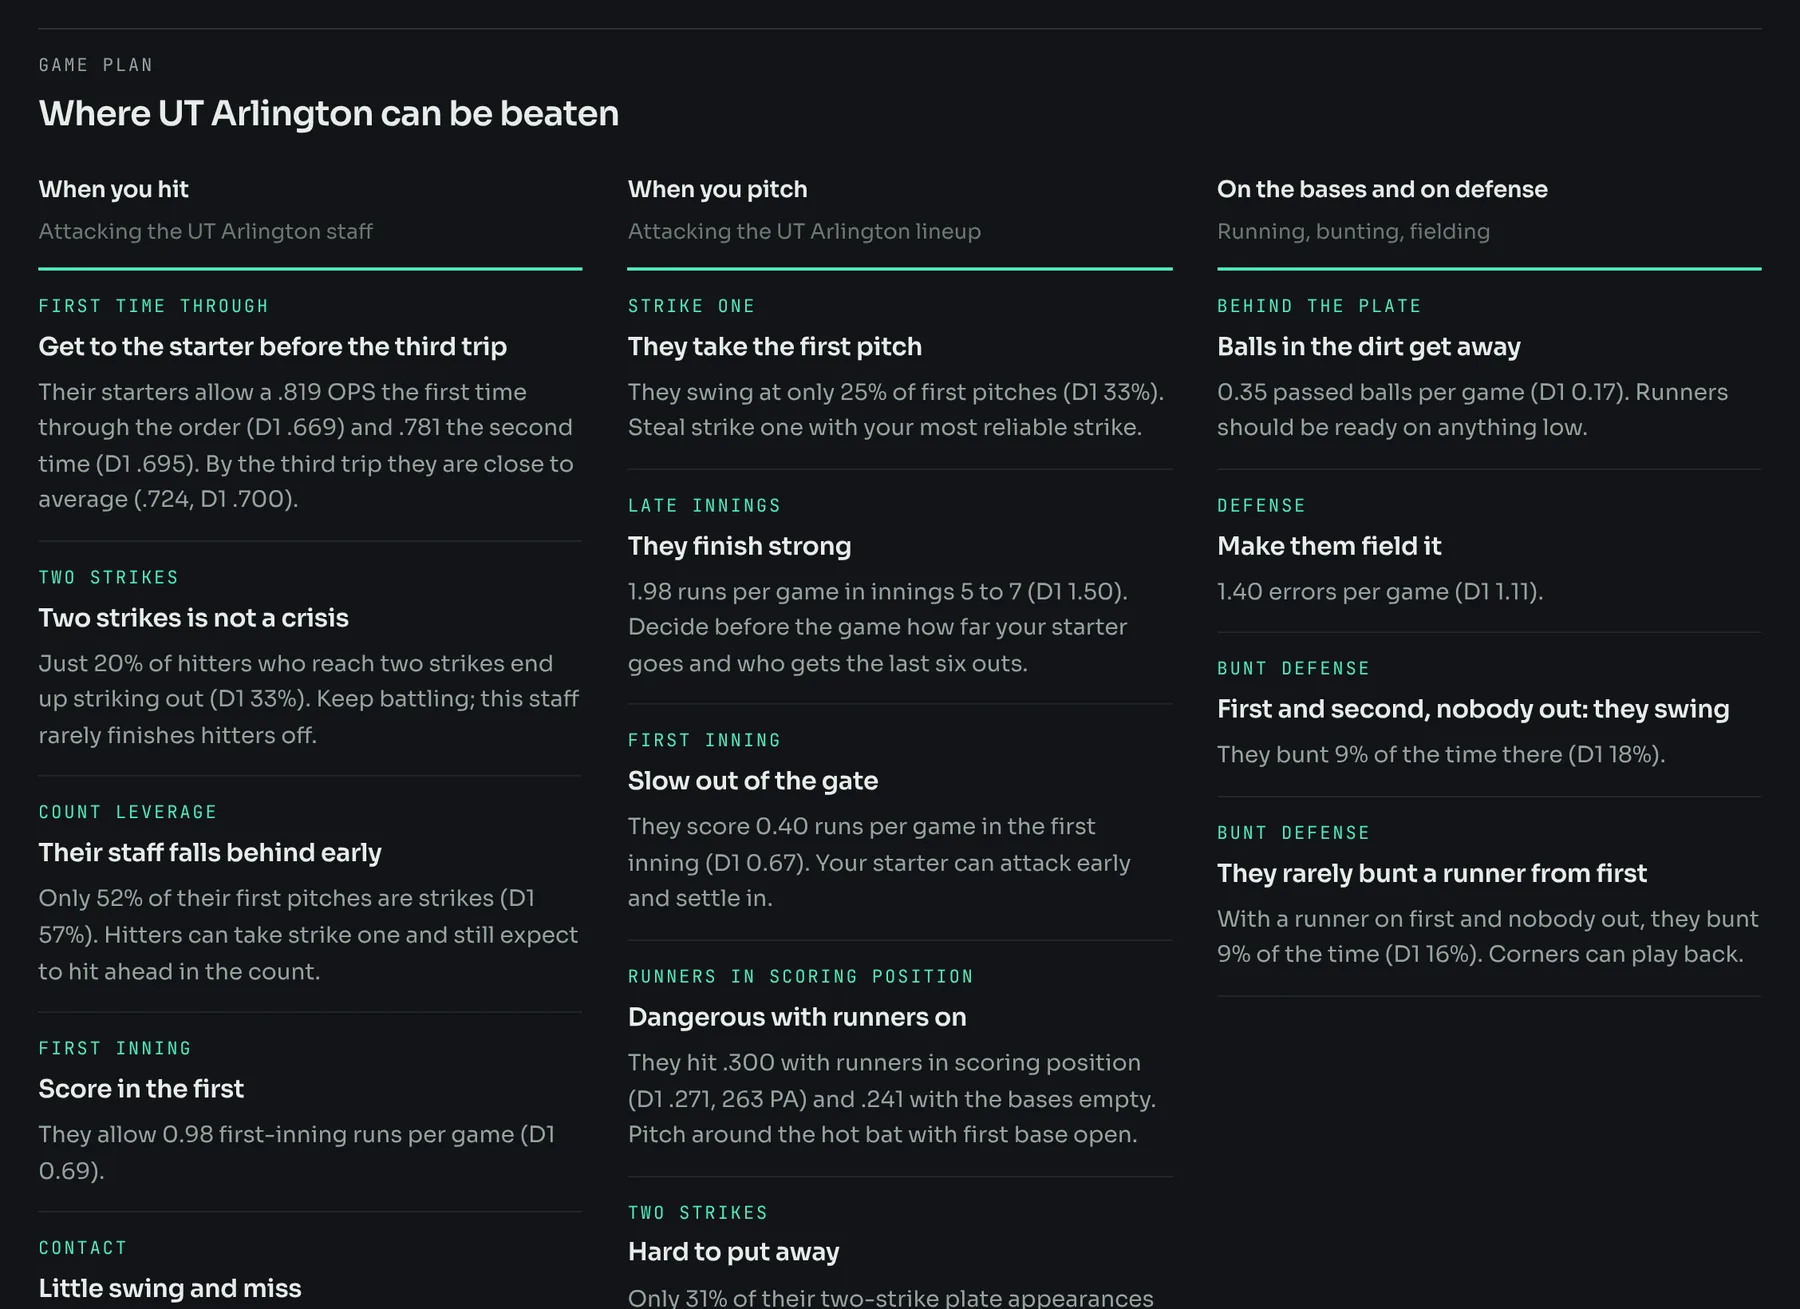
Where they can be beaten
The opponent's biggest departures from D1 average, sorted by how unusual they are and written as instructions.
- At the plate against their staff
- In the circle against their lineup
- On the bases and on defense
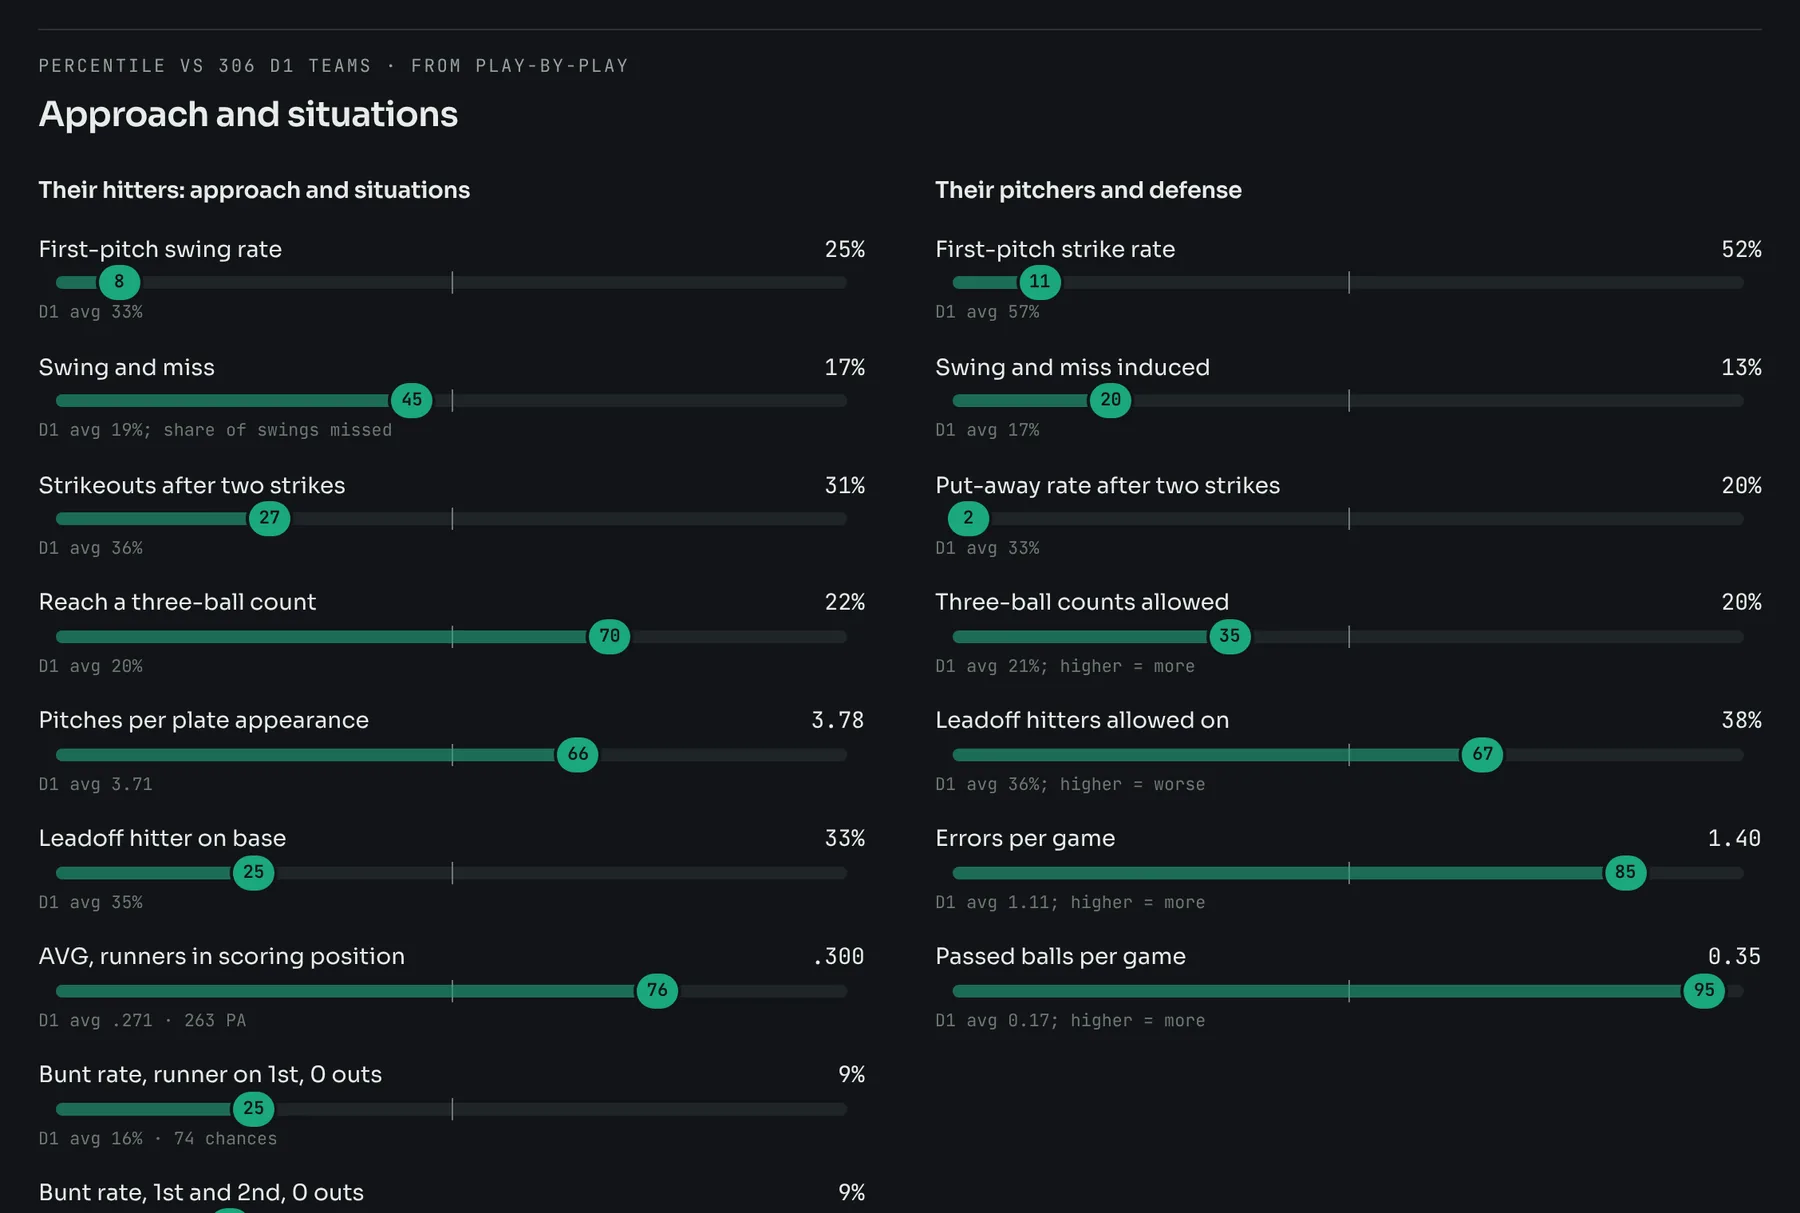
Tendencies, ranked against D1
Every tendency is shown as a percentile against every D1 team, with the D1 average and the sample size beside it.
- First-pitch swing and strike rates
- Bunt rate by base and out situation
- Hitting with runners in scoring position
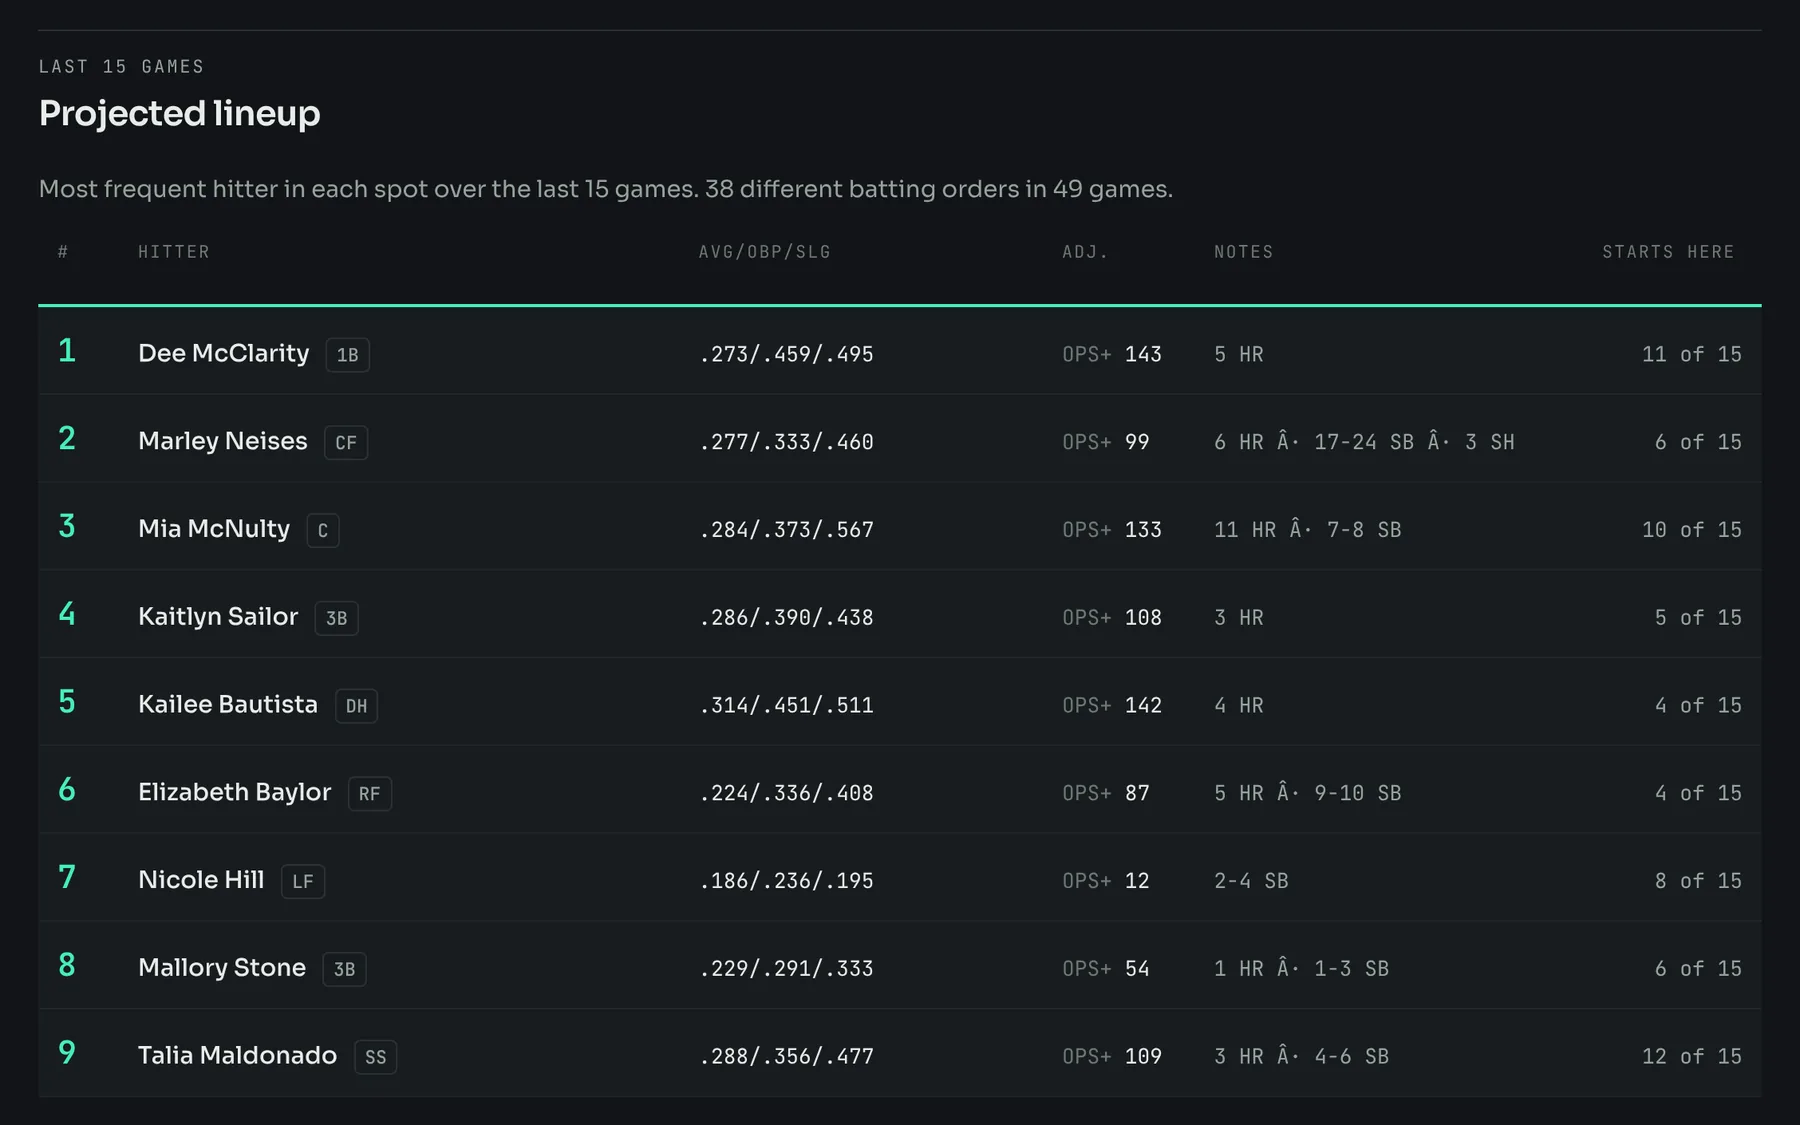
The lineup you will see
Rebuilt from batting order in every box score, with pinch hitters and runners placed under the player they replaced.
- Most likely hitter in each slot
- How often she held it
- OPS+ adjusted for the pitching faced
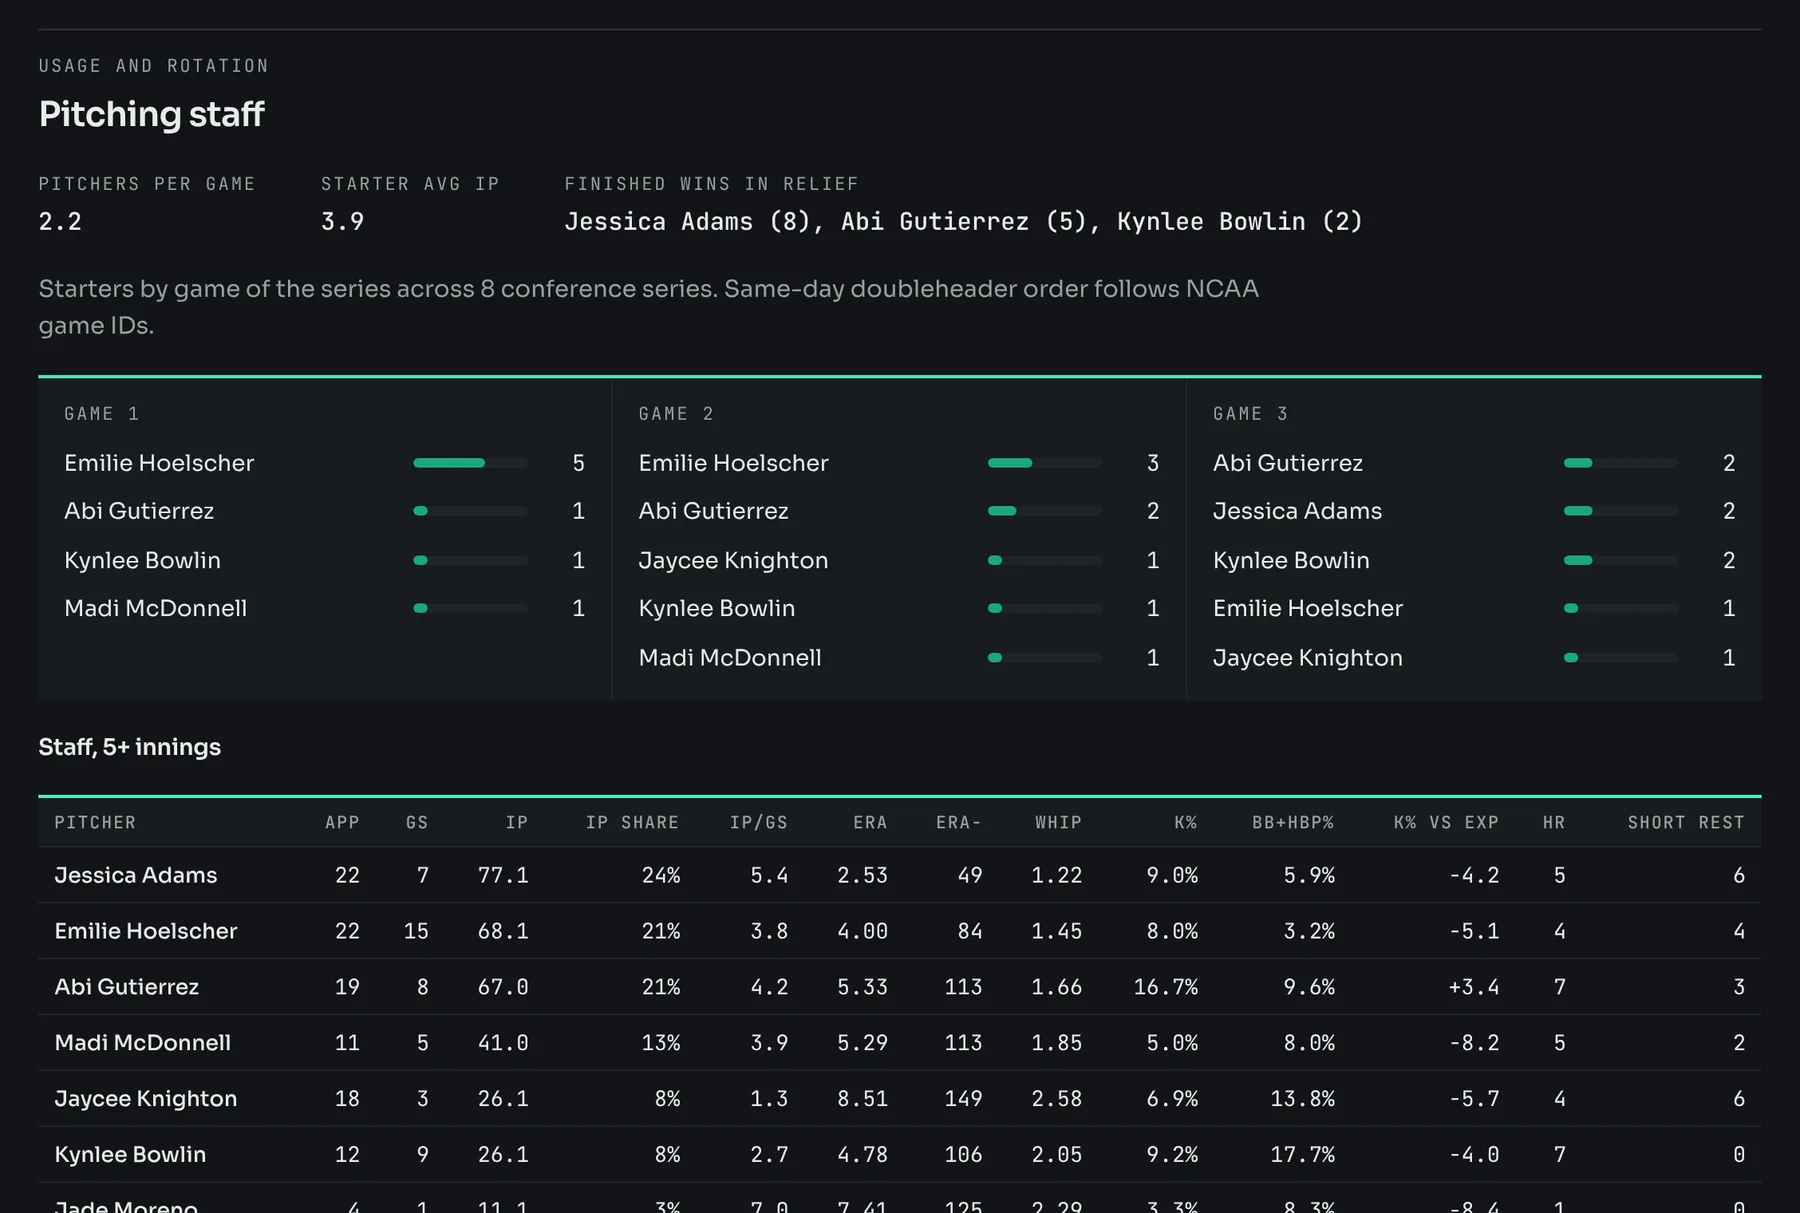
Who pitches when
Weekend rotation from every three-game series, plus rest patterns, short starts and who finishes games.
- Game 1, 2 and 3 starters
- Days of rest before each outing
- ERA− and K% against expected
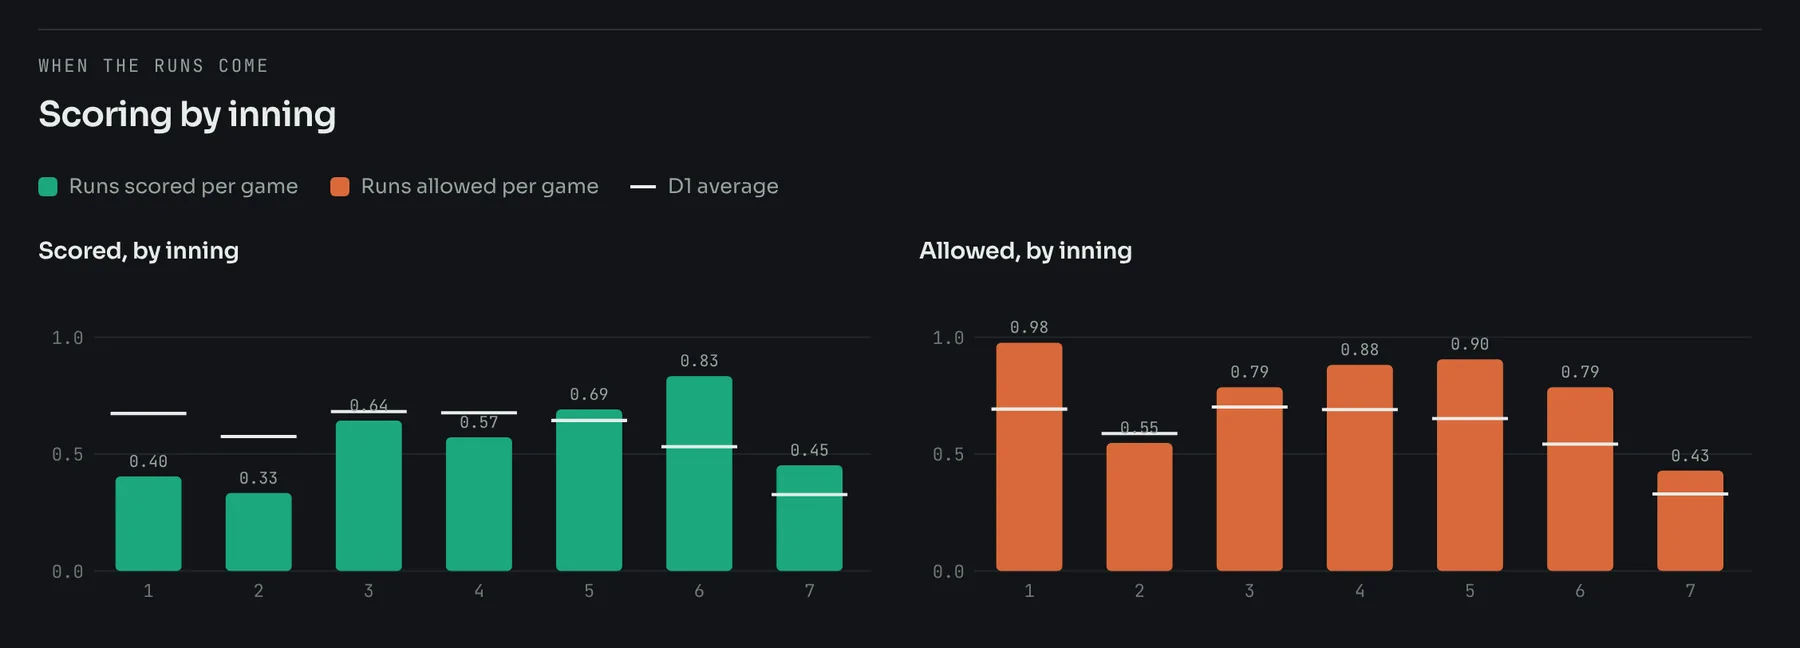
When the runs come
Runs scored and allowed in each inning against the D1 average, from games whose innings add up to the real final score.
- Fast starters and late finishers
- Innings where their staff leaks runs
What is under the hood
Each method below runs on every D1 team, so every number in a report comes with a D1 average and a percentile.
Schedule-adjusted offense and defense
A Poisson model of every D1 score rates each team's offense and defense separately, with a home edge and shrinkage so a thin schedule does not swing the numbers.
Tested on 71,278 games: 71.0% called correctly, against 69.2% for the RPI.
Odds for every game in the series
Ratings for both teams, adjusted for each game's likely starters, give a win chance per game and the odds of every series result.
When the model gave the favorite 80 to 90%, the favorite won 86% of the time.
OPS+ and ERA−
Every hitter is compared with what an average hitter did against the same pitching staffs, and every pitcher with the same lineups. 100 is D1 average.
An ace with an ERA− of 67 allows a third fewer runs than an average D1 arm would against the same teams.
Pitch-by-pitch tendencies
From recorded pitch sequences: first-pitch swing and strike rates, swing and miss, three-ball counts, and how often two-strike counts end in a strikeout.
Sample opponent: swung at 25% of first pitches (D1 33%). Steal strike one.
Bunting, running and clutch hitting
Play-by-play is replayed to track outs and baserunners, giving bunt rates by base and out situation, hitting with runners in scoring position, two-out runs and leadoff on-base rate.
With a runner on first and nobody out, sample opponent bunted 9% of the time (D1 16%).
Who plays and who pitches
Batting orders are rebuilt from box scores, substitutes included. Weekend rotations come from every three-game series, with days of rest before each start.
Sample ace started game 1 in 4 of 6 series and game 3 in 4 of 6.
When starters crack
Plate appearances against each starter split by her first nine batters, the next nine and the rest, compared with every D1 starter.
Sample staff allowed a .819 OPS the first time through (D1 .669).
The math behind the decision
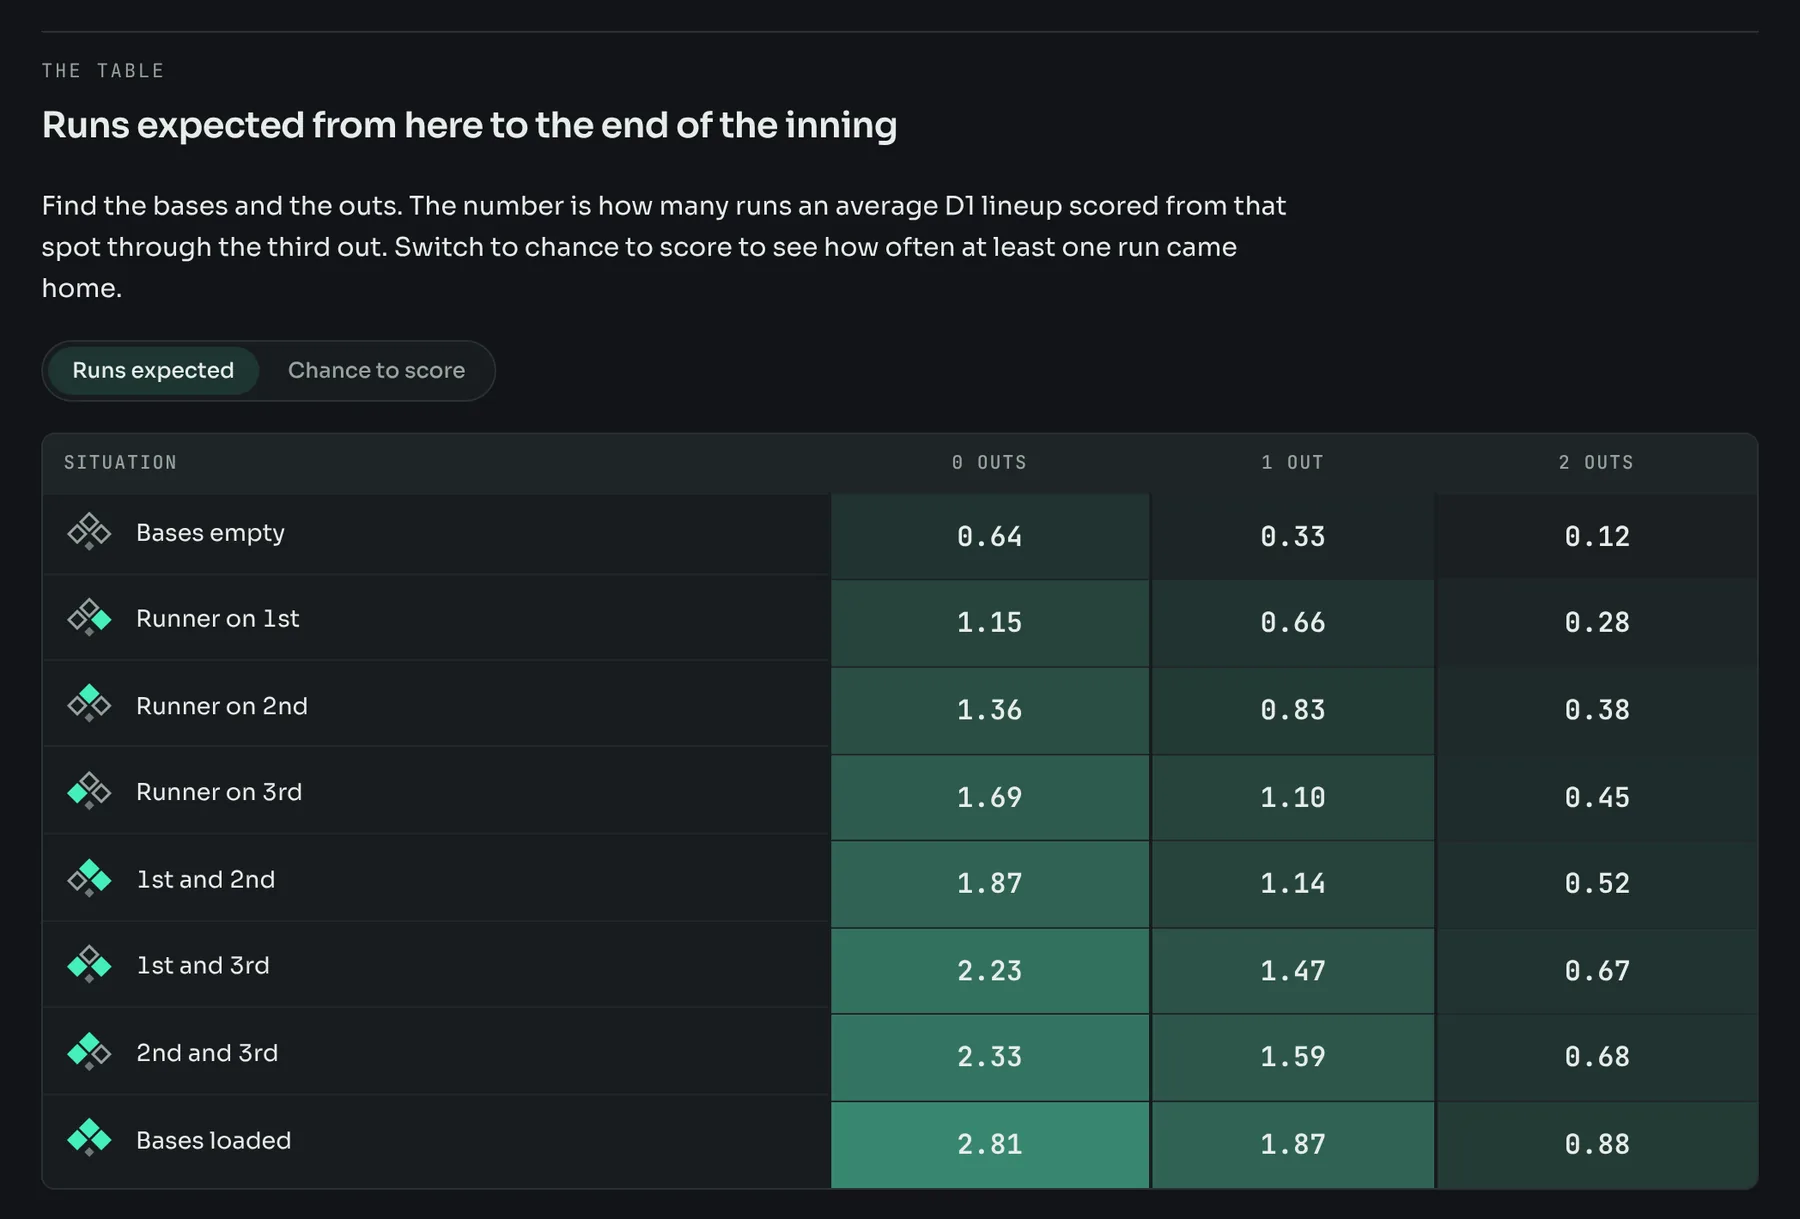
Runs expected from all 24 base and out situations, built from 1.14 million D1 plate appearances, with break-even rates for bunting and stealing.
Bunting a runner from first with nobody out costs 0.17 runs and does not raise the chance of scoring.
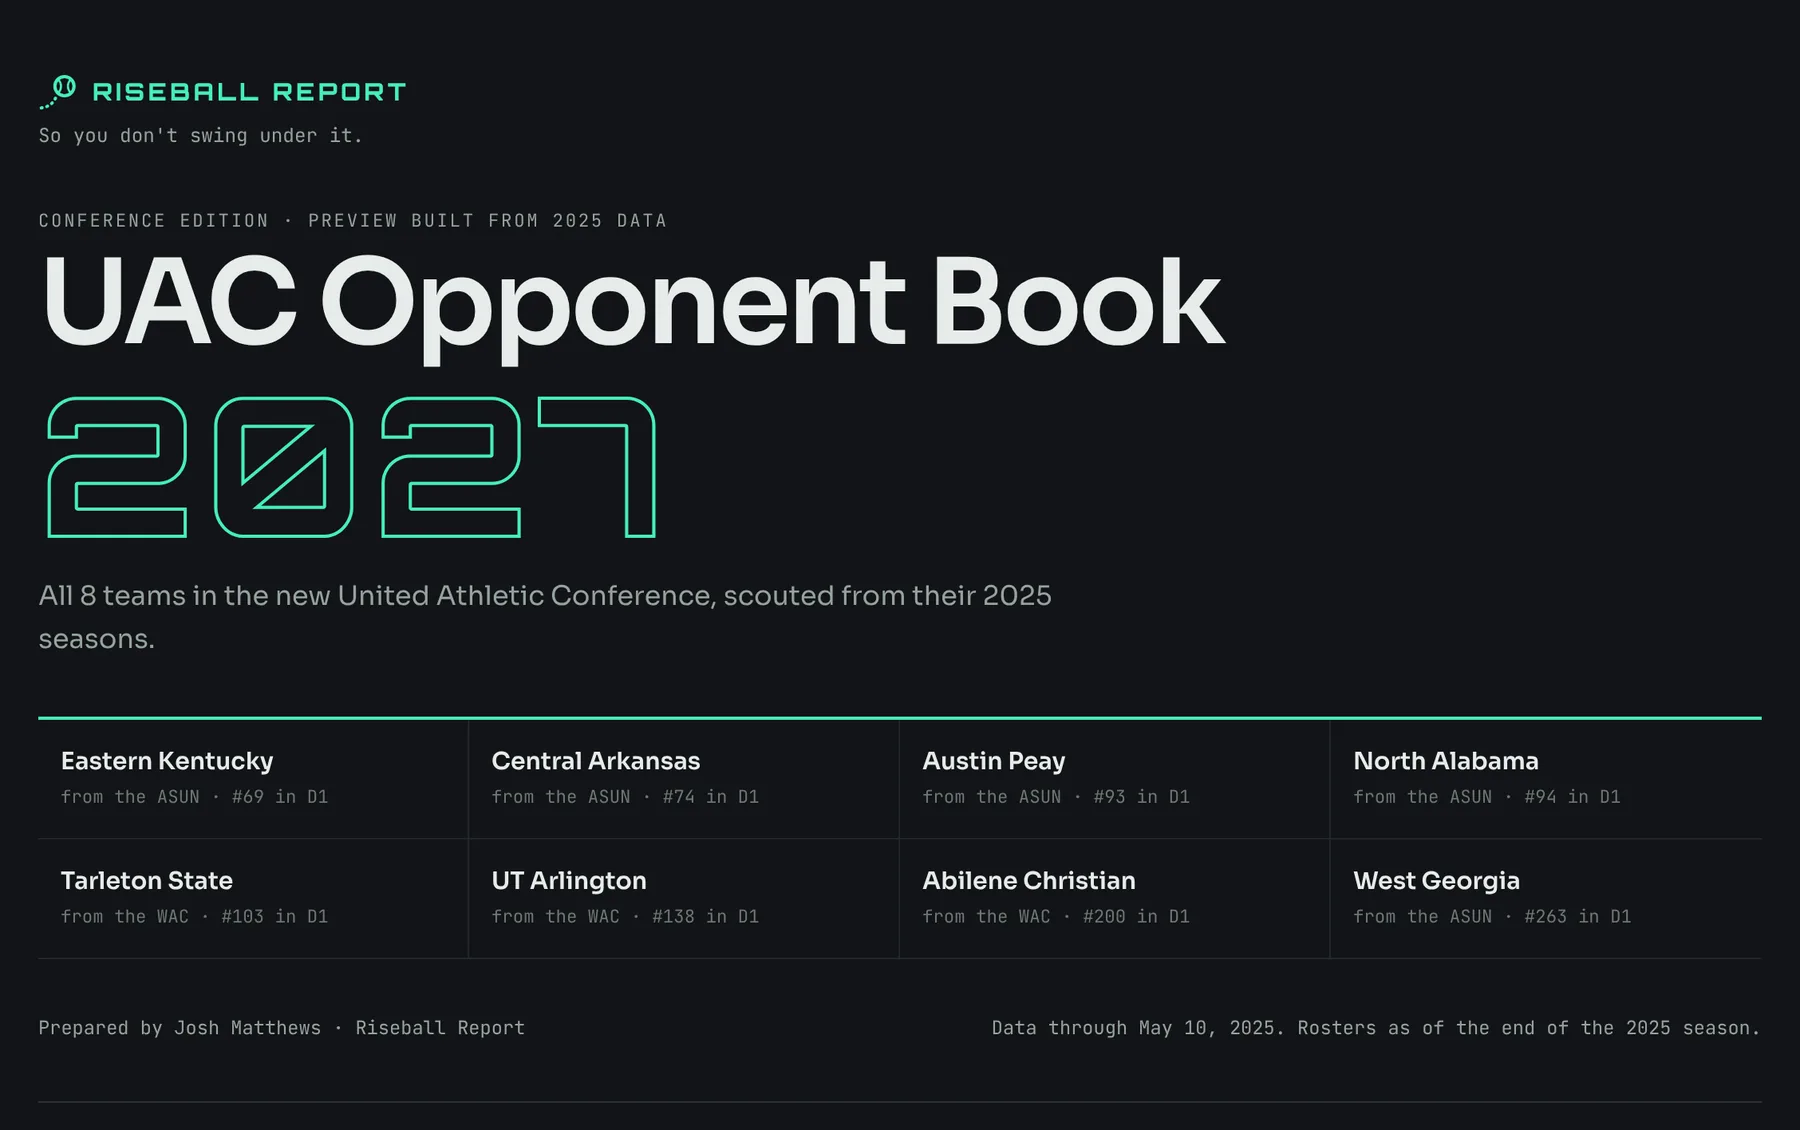
Your whole conference in one book
New conference, new opponents. The UAC Opponent Book scouts all eight members ahead of the conference's first season in 2027, with a section for every team.
- League overview: ratings table, who has never played whom, league extremes and leaders.
- Your edition: leads with your seven opponents and ends with "How your opponents see you", the same section every rival receives.
- January update: departures and transfers flagged, with each team's share of plate appearances and innings that left.
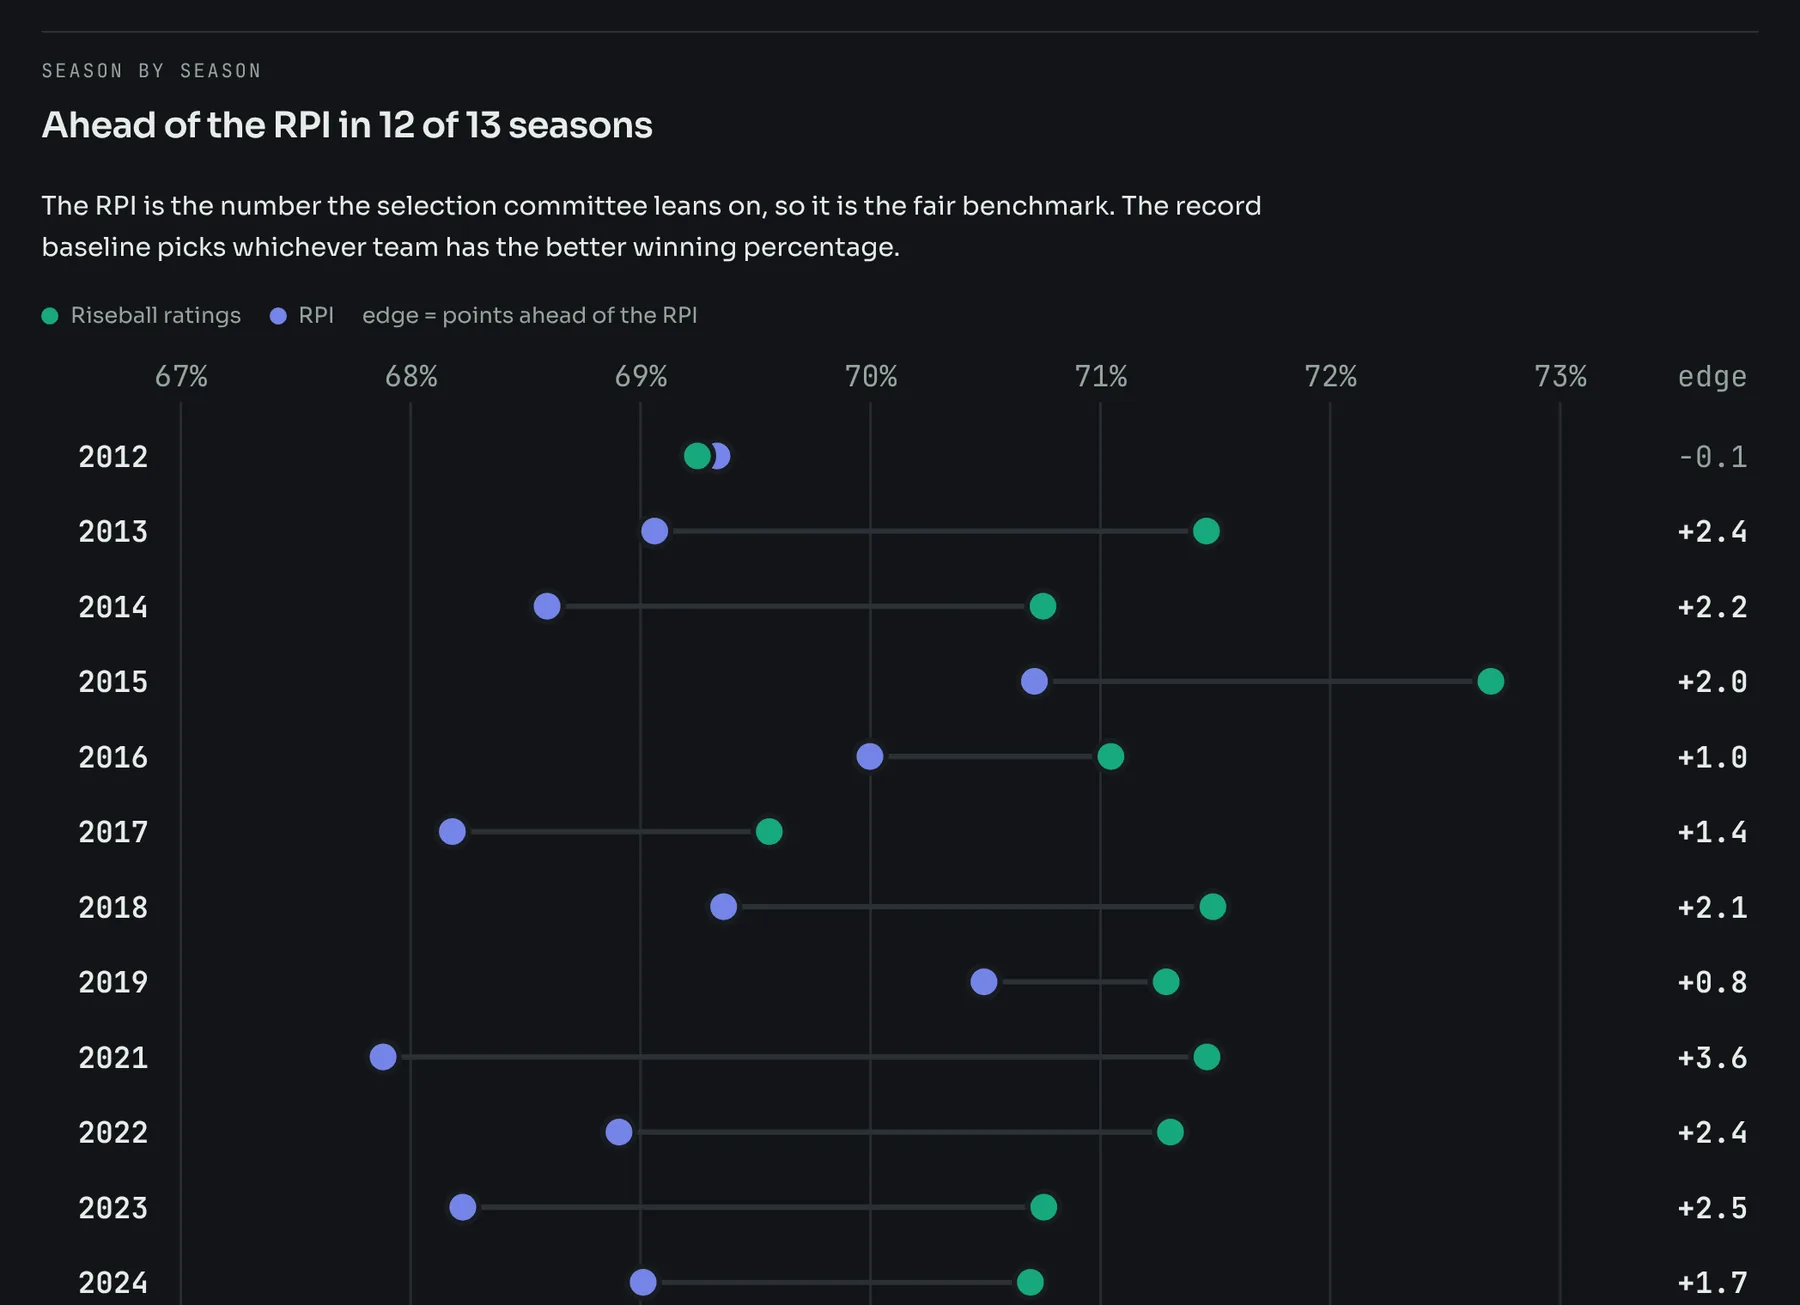
Tested on 13 seasons before it was shown to anyone
Every Monday of every season from 2012 to 2025, the ratings were refit on games already played and asked to pick the next seven days of winners. Nothing a prediction saw came from on or after game day.
- Ahead of the RPI in 12 of 13 seasons, and in the NCAA tournament.
- When the two disagreed, in 10,115 games, the ratings were right 56% of the time.
- Calibrated: every probability band landed within 2 points of how often favorites actually won.
Free studies of the D1 game
Open methods, real numbers, written for coaches.
Three steps, no login
- Step 1
Tell me the series
Your school, the opponent and the dates. Use the form below or email.
- Step 2
Get the report by Thursday
A web link and a printable PDF, built from every game played through the day before.
- Step 3
Tell me what to change
Want a section your staff uses every week? It goes in the next report.
What coaches ask first
Is it really free?
Yes. Reports are free for coaching staffs. The goal is to build something staffs trust and use every week.
Where does the data come from?
Public NCAA box scores and play-by-play for every Division I game. Riseball Analytics is independent and is not affiliated with the NCAA.
How current is a report?
Each report uses every game played through the day before your series opens, and says so on the cover.
Can I see how opponents see my team?
Yes. Ask for your own team and you get the same report your opponents would get. Conference books include it as their final section.
Who else sees our report?
Only your staff. A report requested for your series goes to you and is not posted publicly. The reports on this site are samples built on past seasons.
Do you cover other conferences?
Any D1 opponent can be scouted. Conference books start with the UAC; ask if you want one for yours.
Built by a coach who builds data tools
Riseball Analytics is run by Josh Matthews in Fort Worth, Texas. Josh is the founder and head coach of Texas Belles Fastpitch, a select softball organization, and builds data pipelines and analytics tools for a living.
The Riseball Report started as a question every coach asks on Wednesday night: what do we actually know about this team? The answer turned into a system that scouts every D1 opponent the same careful way.
Email: reports@riseballanalytics.com